Food spending
How much should you spend on groceries?
Every page that ranks for this search hands over a flat monthly figure with no household size attached to it. The three surveys this site can name do not agree on how to measure food spending, and two of them cannot give a total at all. What they can do, read carefully, is show where a grocery bill actually moves.
A grocery bill is not one decision, it is dozens of them spread across a month, and most of those decisions are not really optional. Milk, bread and the weekly shop happen whether the month is going well or badly. What changes month to month, and what a published average can never price for your specific household, is everything eaten that nobody cooked: takeaway, delivery, a meal out. Answering "how much should I spend on groceries" honestly means answering two separate questions, not one.
What the published surveys actually say
The US Bureau of Labor Statistics runs the Consumer Expenditure Survey, and its 2024 data, released in December 2025, put average annual household spending on food at 10,169 dollars, 12.9 percent of the 78,535 dollar average total. The survey reports that figure split in a way worth reading rather than skimming past: food at home accounted for 6,224 dollars of it, and food away from home for the remaining 3,945. Divide each by fifty two weeks and the shape reads as roughly 120 dollars a week on the shop and 76 dollars a week on everything eaten outside the house, for the average household in that survey. That is this site's own arithmetic on a published annual figure, not a weekly number the survey states directly, and it is worth keeping that distinction in mind before repeating either half of it as a target.
The UK Office for National Statistics runs the Family Spending release, and its bulletin for the year to March 2025, released 11 June 2026, does not publish a single weekly total for food and non-alcoholic drinks in its own text. What it states instead is a rise: 3.20 pounds, 5 percent, in nominal terms over the year, of which 1.60 pounds, 2 percent, was a real terms increase once general inflation is stripped back out. The gap between those two figures matters more than either headline number on its own, because it says that most of the year's growth in food spending was prices moving, not households buying more. The same bulletin records restaurants and hotels rising 2.80 pounds, 6 percent, in real terms over the same year, so both halves of a UK household's food spending, the shop and the meal out, moved in the same direction that year even without a total to set them against.
The Australian Bureau of Statistics publishes the Household Spending Indicator monthly, built from aggregated, de-identified bank card transactions rather than a household survey, and food is one of the nine spending categories it tracks. Its July 2026 release, published 27 August 2026, recorded food spending up 1.0 percent month on month, in seasonally adjusted, current price terms. That is a genuine, checkable figure, and it is not an answer to what share of an Australian household's spending goes on food, because the indicator was built to measure change from one month to the next rather than a share of a total, the same structural gap this site has named before on the average household spending guide. Where the US survey can say what portion of a year's spending food claimed, the Australian data can only say that food spending is currently rising, which is a different and narrower question.
Groceries are not one envelope
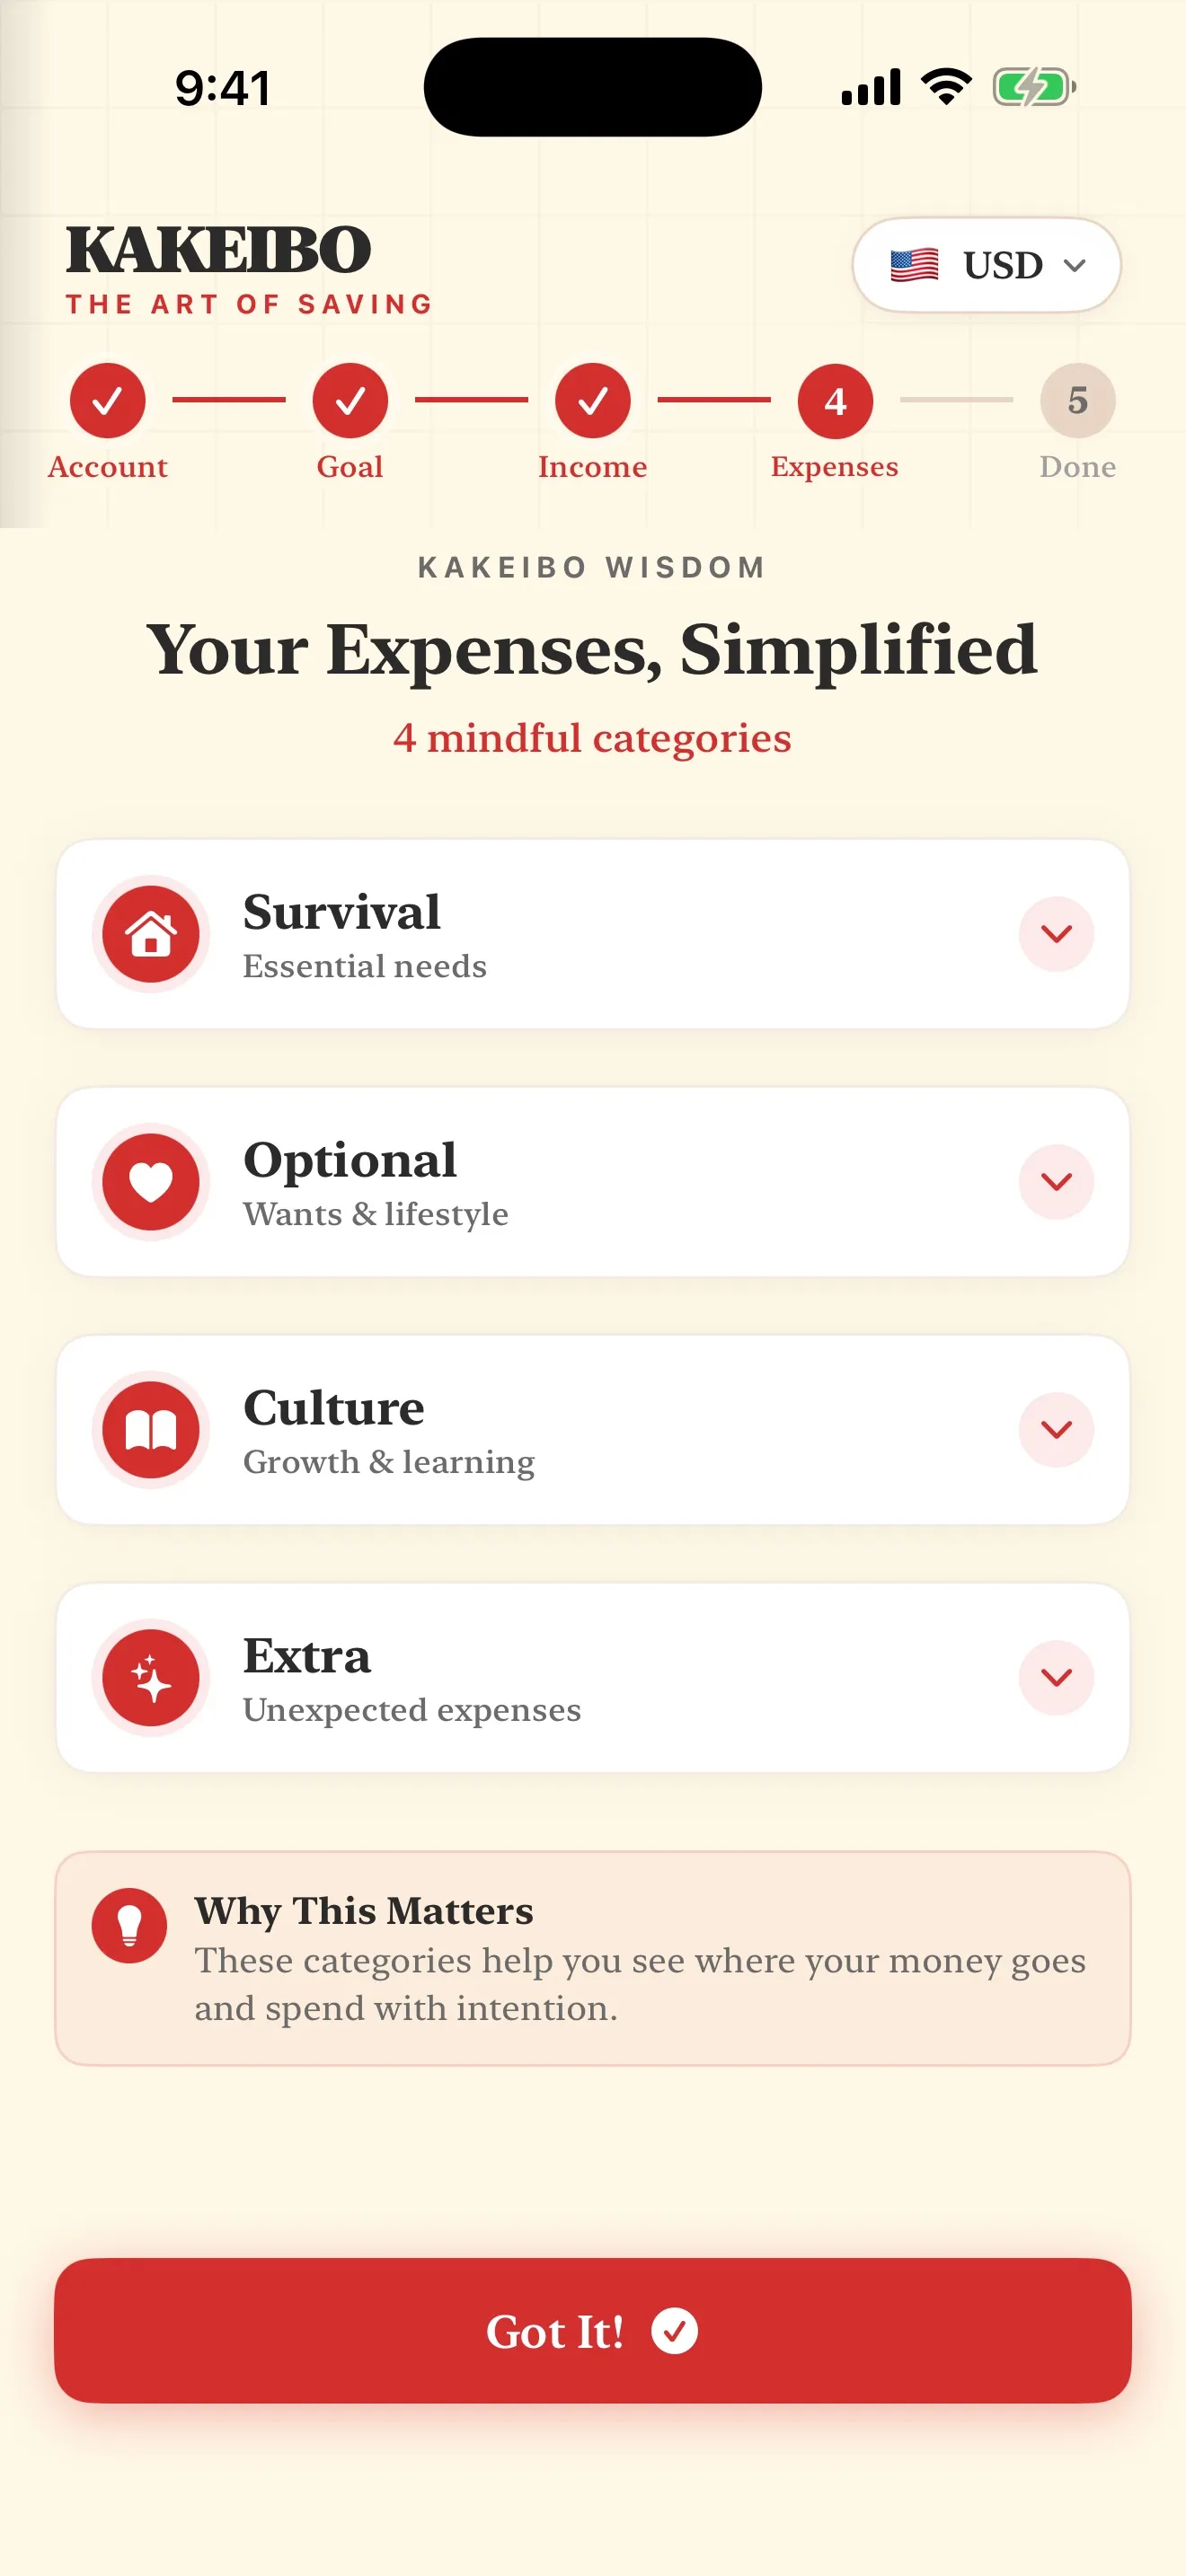
The reason a single grocery target never quite fits is that food spending sits across two of the four categories, not one. The weekly shop, the food you actually cook, belongs in Survival: it happens whether the month is generous or tight, and cutting it has a real cost attached. Takeaway, delivery and a meal out belong in Optional, because each one is a decision made in a specific moment that could have gone the other way. Filing all of it under one line is how a food budget goes vague, because Survival is supposed to be the number that does not move much, and Optional is supposed to be the number a bad week actually changes.
Most weeks sort cleanly. The genuinely hard cases, a grocery delivery with a bottle of wine already in the basket, a coffee bought on the way to work that replaces nothing, get argued out properly in needs versus wants, and the working list of what goes where more generally is in the four categories guide. The rule that survives most of the borderline cases on its own is short: if cooking it yourself was genuinely the alternative, it is Survival; if the alternative was doing without, it is Optional.
Pricing your own number, per week and per person
Take a two person household spending 150 dollars a week on the shop and 60 dollars a week on takeaway and meals out. That prices out to 75 dollars a week per person on the shop, sitting in Survival, and 30 dollars a week per person on food eaten outside the house, sitting in Optional. Neither figure is right or wrong by itself, and neither should be checked against the BLS numbers above as though they were a target: the survey reports a household total without publishing the household size behind it in the same table this guide is citing, so a direct per person comparison would be borrowing a precision the source cannot back up.
What the two numbers are good for is a comparison against your own income rather than a stranger's. Run them through the four category split calculator alongside rent, utilities, insurance and transport, and see whether Survival, with the weekly shop inside it, still leaves genuine room for savings and for Optional, Culture and Extra. A household whose shop alone crowds out the other three envelopes is looking at a different problem than one whose shop fits comfortably but whose takeaway line has crept up unnoticed, and the two problems have different fixes.
Three changes that survive a bad week
None of what follows is a meal plan and none of it is a coupon spreadsheet. Both ask for a kind of planning discipline that most households do not sustain past a fortnight, and the argument behind this whole method is that a daily entry and a monthly reflection do the same job with far less upkeep.
- Price the recurring shop once, then watch the variance. Work out what an ordinary week's shop actually costs and write it down. A month it swings well above that baseline is a genuine signal worth a second look, cheaper flour or fewer takeaways will not fix a problem that turns out to be the shop itself. A month it holds steady needs no action at all, which is most months.
- Cap takeaway by a count, not a dollar figure.Deciding on two takeaway meals a week is a rule you can check in the moment, at the door with the app open. A rule that says forty dollars a week on takeaway asks you to do arithmetic on a running total at exactly the point you are least inclined to do it, which is why dollar caps on this particular line rarely survive a busy week.
- Move the decision to before you open the app.The same principle the credit card guide argues for a tapped payment applies here: the pause that changes behaviour is not the cooking, it is the moment of deciding to order. Naming the choice, and the envelope it will sit in, before the app opens keeps that pause where it can still do something.
Where this leaves the rest of the month
A grocery bill is one of the few Survival numbers with a genuinely optional twin sitting right next to it, which is exactly why it rewards being split rather than averaged into one line. Price the shop honestly, cap the takeaway by count, and check both against income with the safe to spend calculator rather than a stranger's published share. The same four categories this split runs on are set out from the start at the kakeibo method, and none of it depends on matching a survey that was never measuring your household in the first place.
Common questions
- How much should I spend on groceries each week?
- There is no single correct figure, because a grocery bill depends on household size, diet and city in a way no published survey can answer for you. Price your own recurring weekly shop once, then check whether Survival, with that shop inside it, still leaves room for savings and the other three envelopes. That test tells you more than any published average could.
- What does the average household actually spend on food?
- The US Bureau of Labor Statistics Consumer Expenditure Survey, 2024 data released December 2025, put average annual household food spending at 10,169 dollars, 12.9 percent of the average total. That splits into 6,224 dollars on food at home and 3,945 dollars on food away from home. The UK and Australian sources this site cites do not publish a comparable total, for reasons worth reading rather than skipping past.
- Does takeaway and eating out count as part of the grocery budget?
- No, and treating it as one line is the most common way a food budget goes vague. The weekly shop, the food you cook yourself, sits in Survival because it has to happen regardless of the month you are having. Takeaway, delivery and meals out sit in Optional, because each one is a choice made in a moment you could have chosen differently.
- Why can't the UK and Australian figures be compared to the US total the same way?
- The UK Office for National Statistics Family Spending bulletin for the year to March 2025 states a rise in food spending, 3.20 pounds nominal, 1.60 pounds real, rather than a total. The Australian Bureau of Statistics Household Spending Indicator is a monthly index built from bank transaction data, reporting a 1.0 percent month on month rise in food spending in its July 2026 release, not a share of total spending at all. Both are genuine, checkable figures. Neither is the same kind of number the US survey publishes.
- How do I actually bring a high grocery bill down?
- Not with a meal plan or a coupon spreadsheet, which ask for a kind of upkeep most households do not sustain past a fortnight. Price the recurring shop once and watch what changes it, cap takeaway by a count rather than a dollar figure, and move the decision on whether to order to the moment before you open the app rather than the moment the food arrives.
- Is grocery spending Survival or Optional in kakeibo?
- Both, split by what the money actually bought. The weekly shop that keeps the household fed is Survival. Anything that replaces cooking by choice rather than necessity, takeaway, delivery, a meal out, is Optional. The same test that resolves this is worked through more fully in the needs versus wants guide for the borderline cases, a coffee on the way to work or a grocery order with wine already in it.
Price the shop. Cap the takeaway. Check both against income.
A grocery bill splits cleanly into two envelopes once you stop averaging it into one. Survival absorbs the shop, Optional absorbs the rest, and the split is worth more than any published figure.