
Kakeibo MethodThe household ledger
Get the Kakeibo app free

The household ledger

Free calculator

Your savings rate

Amounts are not comparable across months because incomes move. A rate is, which is what makes it the number worth writing at the top of every reflection.

Rate and cover

Why a rate and not an amount

An amount tells you about one month. A rate tells you about a habit, because it survives a pay rise, a quiet December and a month with five Fridays in it. Two months with the same amount saved can be a good month and a bad one, and only the rate can tell them apart.

It is also the number that scales. Raising a rate by a few points compounds through every future month, while cutting one purchase does not. That is the argument for looking at this figure once a month rather than at individual line items.
Counting debt repayment

Payments above the minimum on a debt raise your net position exactly the way a transfer into savings does, so count them. Minimum payments belong in the Survival envelope instead, because missing them has consequences that are not about saving at all.

What we are not going to tell you

We are not going to publish a benchmark savings rate, and we are not going to repeat the claim that circulates in this niche about kakeibo users saving some fixed percentage more. We could not find a primary source for it, and a statistic you cannot check is worse than no statistic. What the method demonstrably does is make spending visible while it happens, which is a mechanism rather than a promise.

Your own trend is the benchmark worth having. Write the rate at the top of every monthly reflection, and by the third one you will have something no average could tell you. The prompts for that are in the four questions guide.

Common questions

How do you calculate a savings rate?
Divide what you saved by what you took home, over the same period. Saving 600 out of 4,000 is a 15 percent savings rate. Use take home pay rather than gross, and count debt repayments above the minimum as saving, because they raise your net position the same way.
What is a good savings rate?
Higher than last quarter. We are not going to quote a national average at you, because the figure that circulates in this niche has no primary source we can point to, and a number you cannot check is worse than no number. Your own trend over three months is a better guide than anybody else average.
Should the rate use gross or net income?
Net, for household budgeting. Gross rates look better and mean less, because tax is not money you ever had the option to save. Whichever you choose, keep it consistent or the trend becomes meaningless.
What does the months of cover figure mean?
It is your savings balance divided by a typical month of spending, so it answers a more useful question than the balance alone: how long the household keeps running if income stops. Three months is a common target and it is a goal rather than a rule.

One figure at the top of every reflection

Write it down, month after month. The trend is the only benchmark that knows anything about your household.

Get the Kakeibo app freeiPhone and iPad · Free tier, no account needed
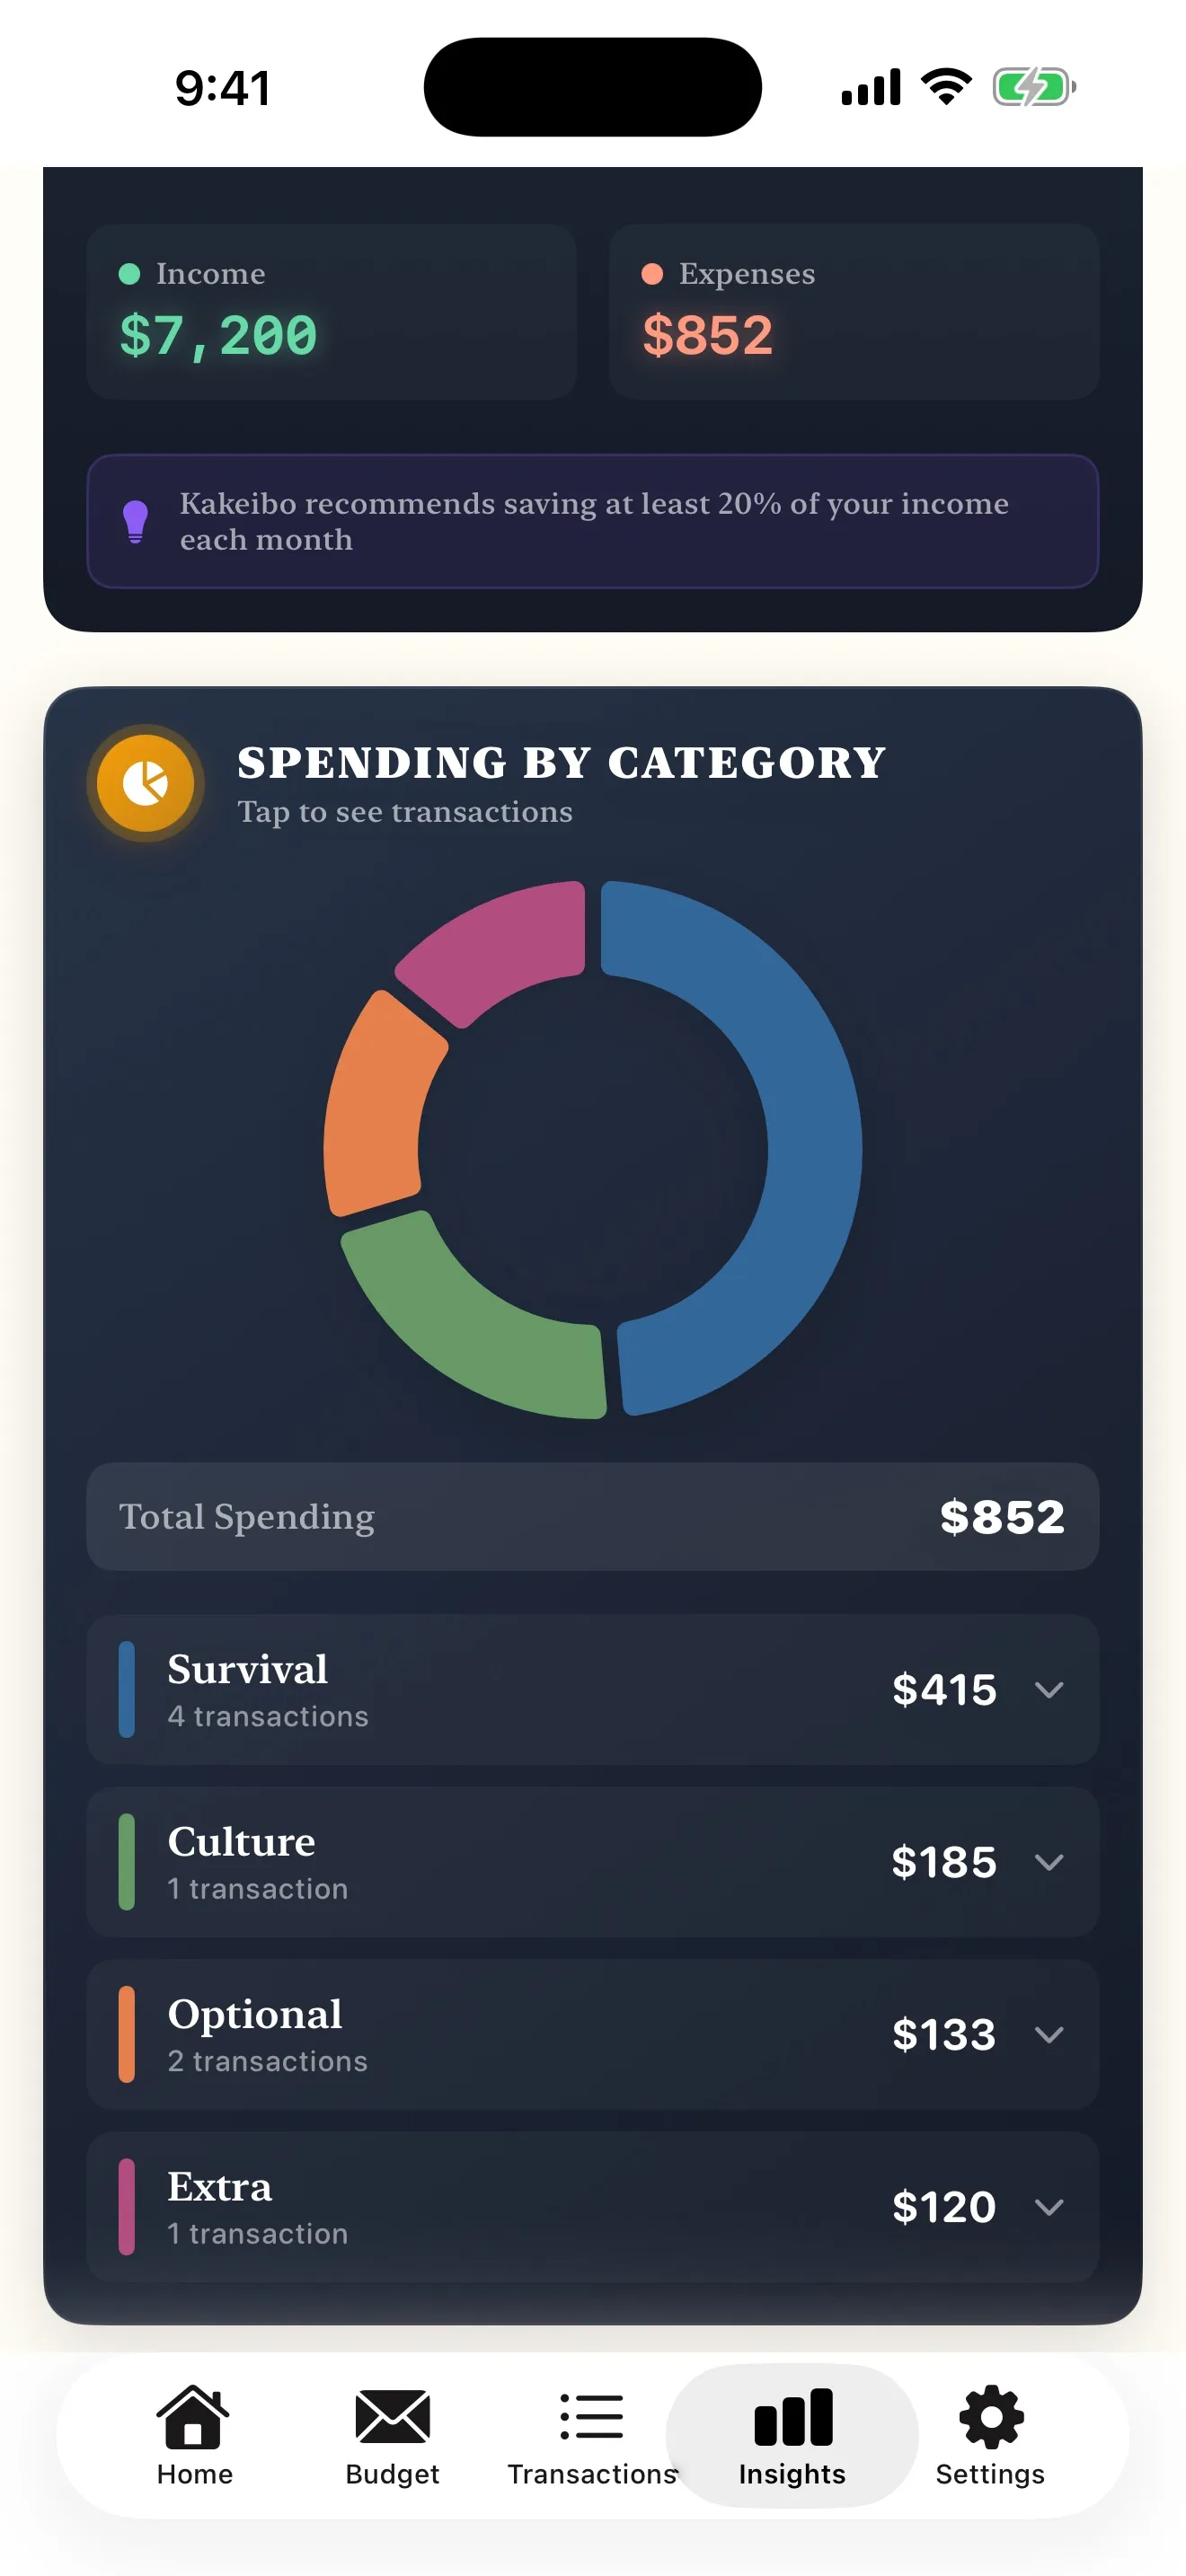
The Kakeibo app showing spending patterns and a goal projection with the monthly amount required